Graphical User Interface Guide
The GUI starting program is defined in ErwinJr.py, which includes two
tabs: the quantum tab and the optical tab.
The quantum tab is mostly a GUI wrapper of QCLayers with a plotting canvas,
while the optical tab is for OptStrata
Quantum Tab
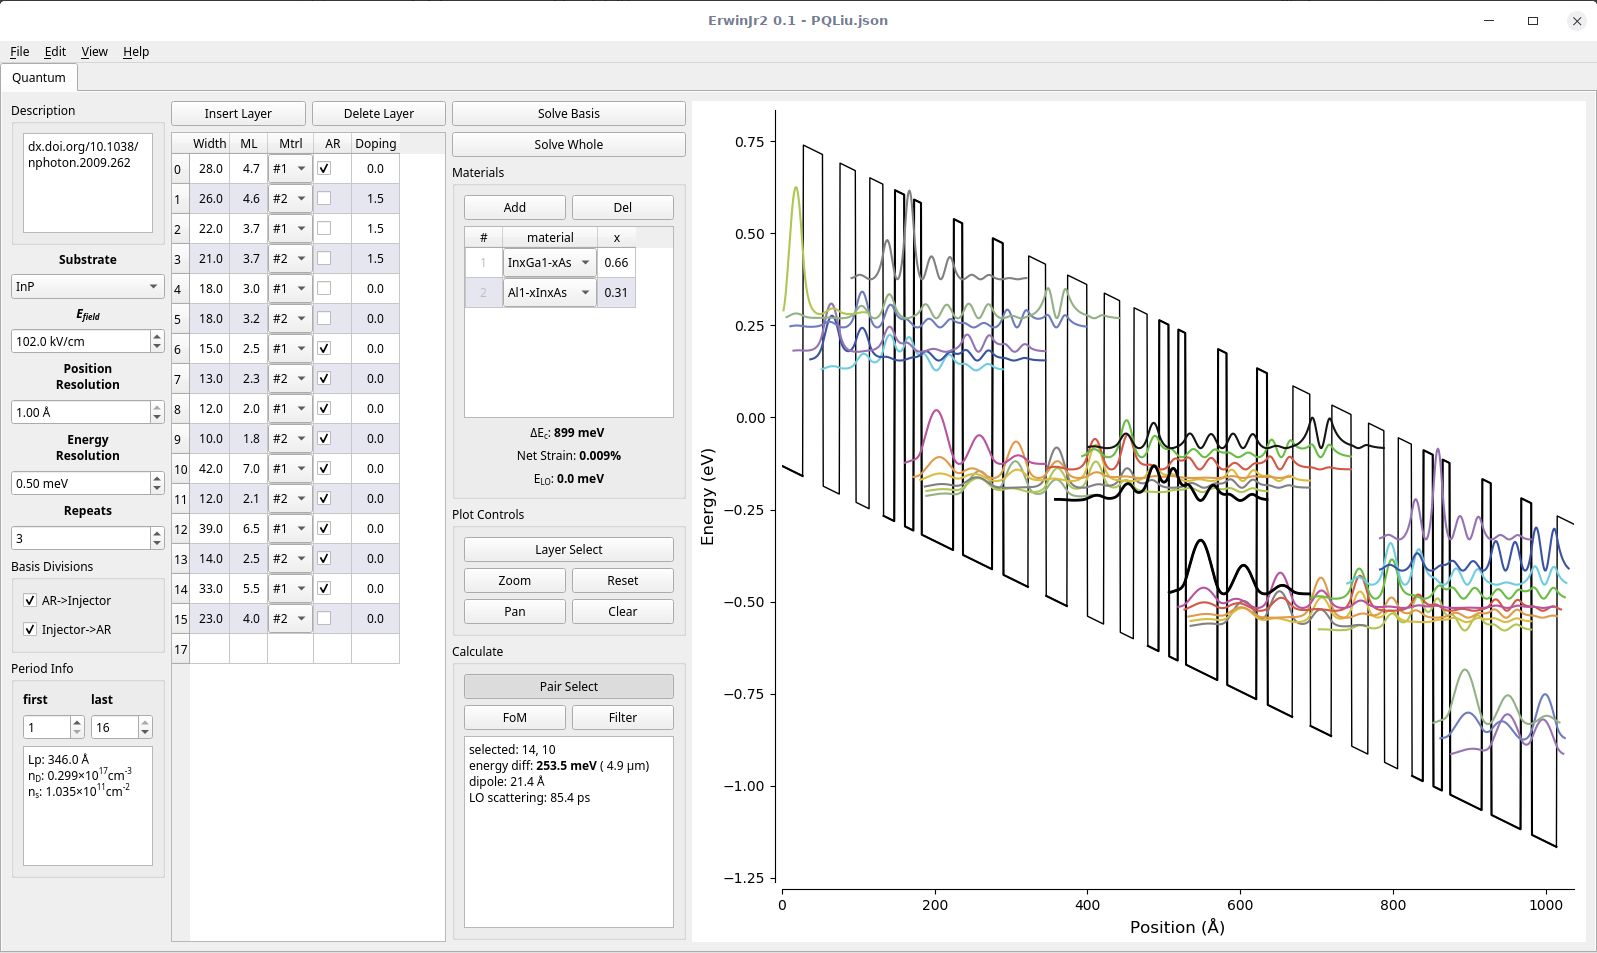
A screenshot of the ErwinJr.py quantum tab.
The interface includes 4 columns:
settingBox |
|
|---|---|
Description |
Used as a comment, not for calculation |
Substrate |
Decide substrate, can influence strain and material set |
E-field |
Global electrical field |
Position resolution |
Finite-element grid size |
Energy resolution |
Scan size for eigen solve root finder. This should be smaller than smallest energy difference. If this is too small it’s possible to lose some states |
Repeats |
Number of the whole structure |
Basis Divisions |
Defined for basis solver. See |
Period info |
Calculate total length, doping density and sheet density |
layerBox |
|
|---|---|
Layer Buttons |
insert above layer and delete selected layer |
Layer Table |
Show the table that defines the layer structure |
solveBox |
|
|---|---|
Solve basis button |
Call |
Solve whole button |
Call |
Material Table |
Define the material used in the structure and give some information about the material |
Plot control |
|
Calculatin box |
|
And a plotting canvas.
Export of the figure and data, save and load actions are embedded into File menu; temperature setting and advanced table settings are in Edit menu; options to choose what is included in the plot is listed in View menu.
Todo
The Optical Tab