QCPlotter module
This module contains functions to plot ErwinJr2.QCLayers
This contains the plotter functions for QCLayers
-
ErwinJr2.QCPlotter.config= {'default_lw': 1.0, 'mode_scale': 3, 'wf_almost_zero': 0.00015, 'wf_colors': ((0.584, 0.45, 0.701), (0.431, 0.486, 0.745), (0.576, 0.694, 0.517), (0.682, 0.78, 0.321), (0.501, 0.501, 0.509), (0.854, 0.741, 0.247), (0.874, 0.607, 0.29), (0.823, 0.341, 0.278), (0.725, 0.321, 0.623), (0.411, 0.741, 0.27), (0.078, 0.078, 0.078), (0.431, 0.803, 0.87), (0.223, 0.321, 0.643)), 'wf_scale': 0.3}¶ The configuration dictionary for plotting.
-
ErwinJr2.QCPlotter.plotPotential(qcl, axes=None, plotVL=False, plotVX=False, plotLH=False, plotSO=False)¶ Plot the potentials of qcl.
- Parameters
qcl (
QCLayers) – The QCLayers to plotaxes (
Optional[Axes]) – The axes to plot the figure on.plotVL (
bool) – flags wether to plot L-point, X-point, LH band, SO bandplotVX (
bool) – flags wether to plot L-point, X-point, LH band, SO bandplotLH (
bool) – flags wether to plot L-point, X-point, LH band, SO bandplotSO (
bool) – flags wether to plot L-point, X-point, LH band, SO band
- Returns
A list of plotted data
-
ErwinJr2.QCPlotter.plotWF(qcl, plotType='mode', fillPlot=False, pickedStates={}, showPeriod=True, axes=None)¶ Plot the wavefunctions of qcl. The wavefunctions are scaled by
scaleWF().- Parameters
qcl (
QCLayers) – The QCLayers to plotplotType (
str) – Can be ‘mode’ or ‘wf’, to determine it’s plotting mode (\(\psi^2\)) or wavefunction itself (\(\psi\)).fillPlot (
Union[bool,float]) – Wether to fill up the wavefunctions. If it’s False or None it will not fill, otherwise it should be a float number smaller than 1, meaning the transparency of the fill color.pickedStates (
Iterable) – A set of state indices that should be plotted in thick black color.showPeriod (
bool) – Flag to whether emphasis the recognized period of wavefunctions.axes (
Optional[Axes]) – The axes to plot the figure on.
- Returns
A list of plotted data
-
ErwinJr2.QCPlotter.scaleWF(qcl, plotType='mode')¶ Helper function to scale the wave function for plotting. The scale factor is decided by
config.
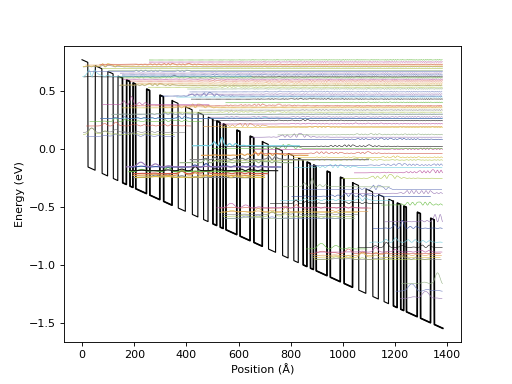
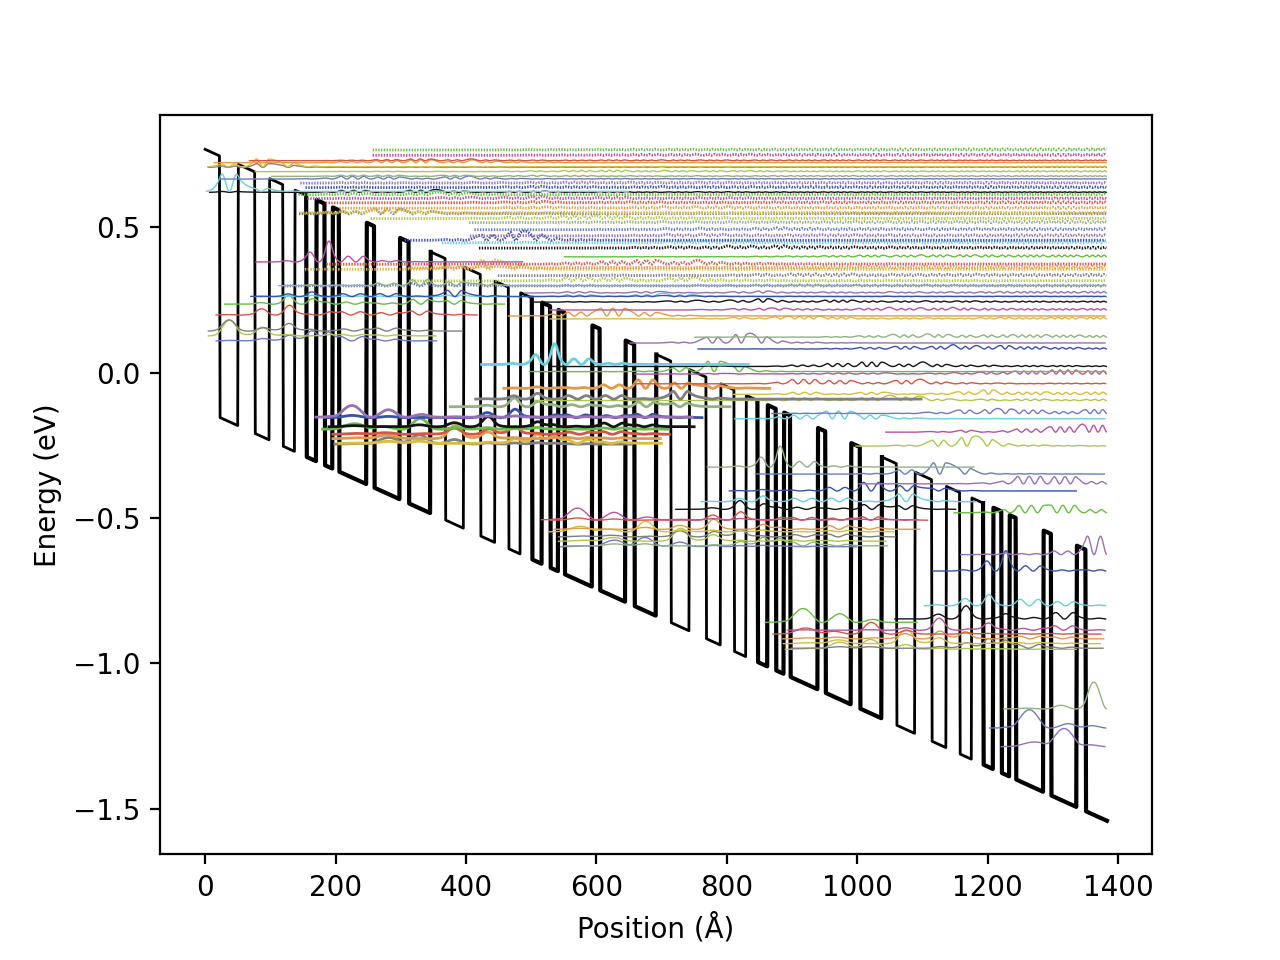
Example
Here is an example of how to construct a QCLayers class and solve for eigen states and wave functions. A sample json file is can be found here.
from ErwinJr2 import SaveLoad
from ErwinJr2.QCPlotter import plotPotential, plotWF
import matplotlib.pyplot as plt

with open("../ErwinJr2/example/PQLiu.json", 'r') as f:
    qcl = SaveLoad.qclLoad(f)

qcl.populate_x()
qcl.solve_whole()
plotPotential(qcl)
plotWF(qcl)
plt.xlabel('Position (Å)')
plt.ylabel('Energy (eV)')
plt.show()
(Source code, png, hires.png, pdf)